
Log analytics: the basics
Azure log analytics workspace is a product for data collection storage. Connect other cloud services with diagnostic settings or install an agent to upload data.
What is it for?
Well, logs are the foundation of nearby everything. Knowledge is power. We have the ability to store the information and data and analyze or draw metrics, graphs and trends. First it may seem as a proactive measurement, but for the future I would call it essential. Think of comprehension of complex processes or events in IT. We encounter this on all IT systems, applications and of course SecOps.
How does it work?
The data collection entries, will be manifested in databases and tables. Later you can run queries on those. Solutions can be built on top of the log workspace. Those are also delivering data into the LAW.
Keep in mind, that a Log Analytics Workspace resource requires an Azure subscription with separate pricing tiers. Official Microsoft source. 5GB are generally included.
What do you do with this data?
Now as your data stream is up and ready, it comes down to use them actually in some way. Visualization with metrics can help to understand better and give prospective trends. Data retention is 30 days by default, but can be scaled for extra pricing. But it is also useful in troubleshooting cases, or system/application actions. And in SecOps logging crucial for investigation.
Integrations
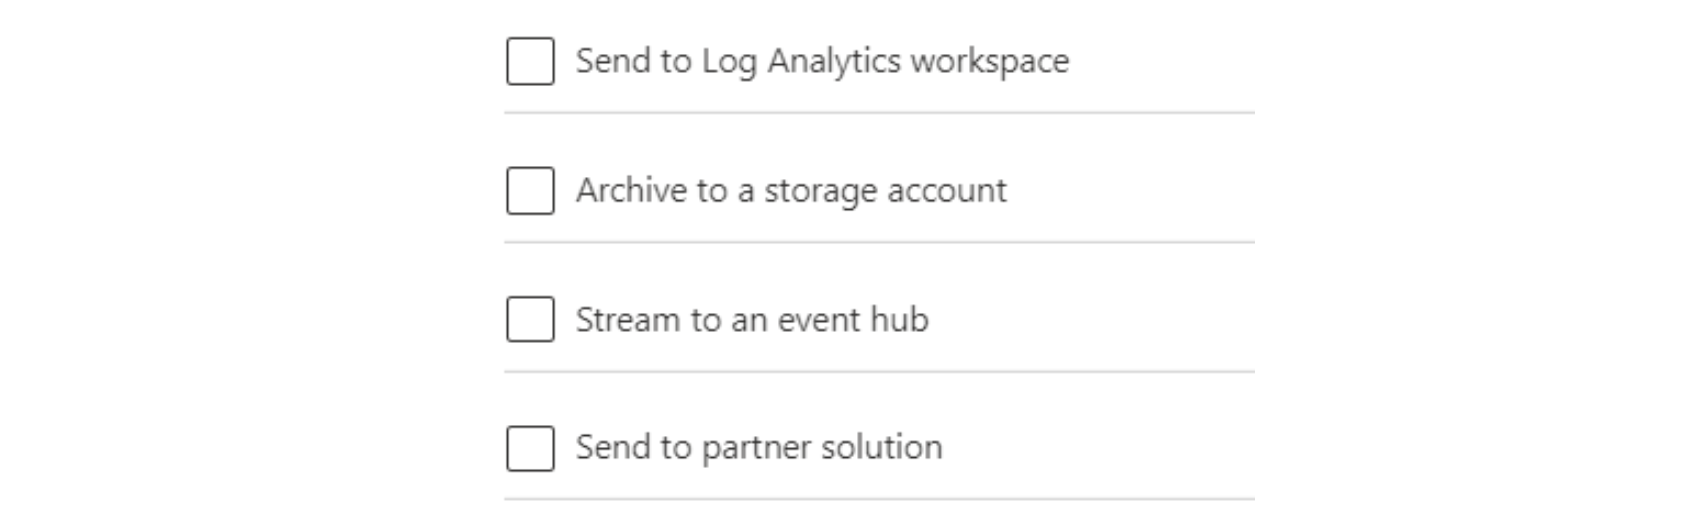
In the Microsoft cloud, some products have the option to connect their diagnostics logs into various storage solutions. You find this under the register "Diagnostics settings".
You will then find the option to choose a destination: (in this case Log Analytics Workspace)
Popular platform log connections:
- Azure Active Directory
- AuditLogs
- SignInLogs
- NonInteractiveUserSignInLogs
- ServicePrincipalSignInLogs
- ManagedIdentitySignInLogs
- ProvisioningLogs
- ADFSSignInLogs
- RiskyUsers
- UserRiskEvents
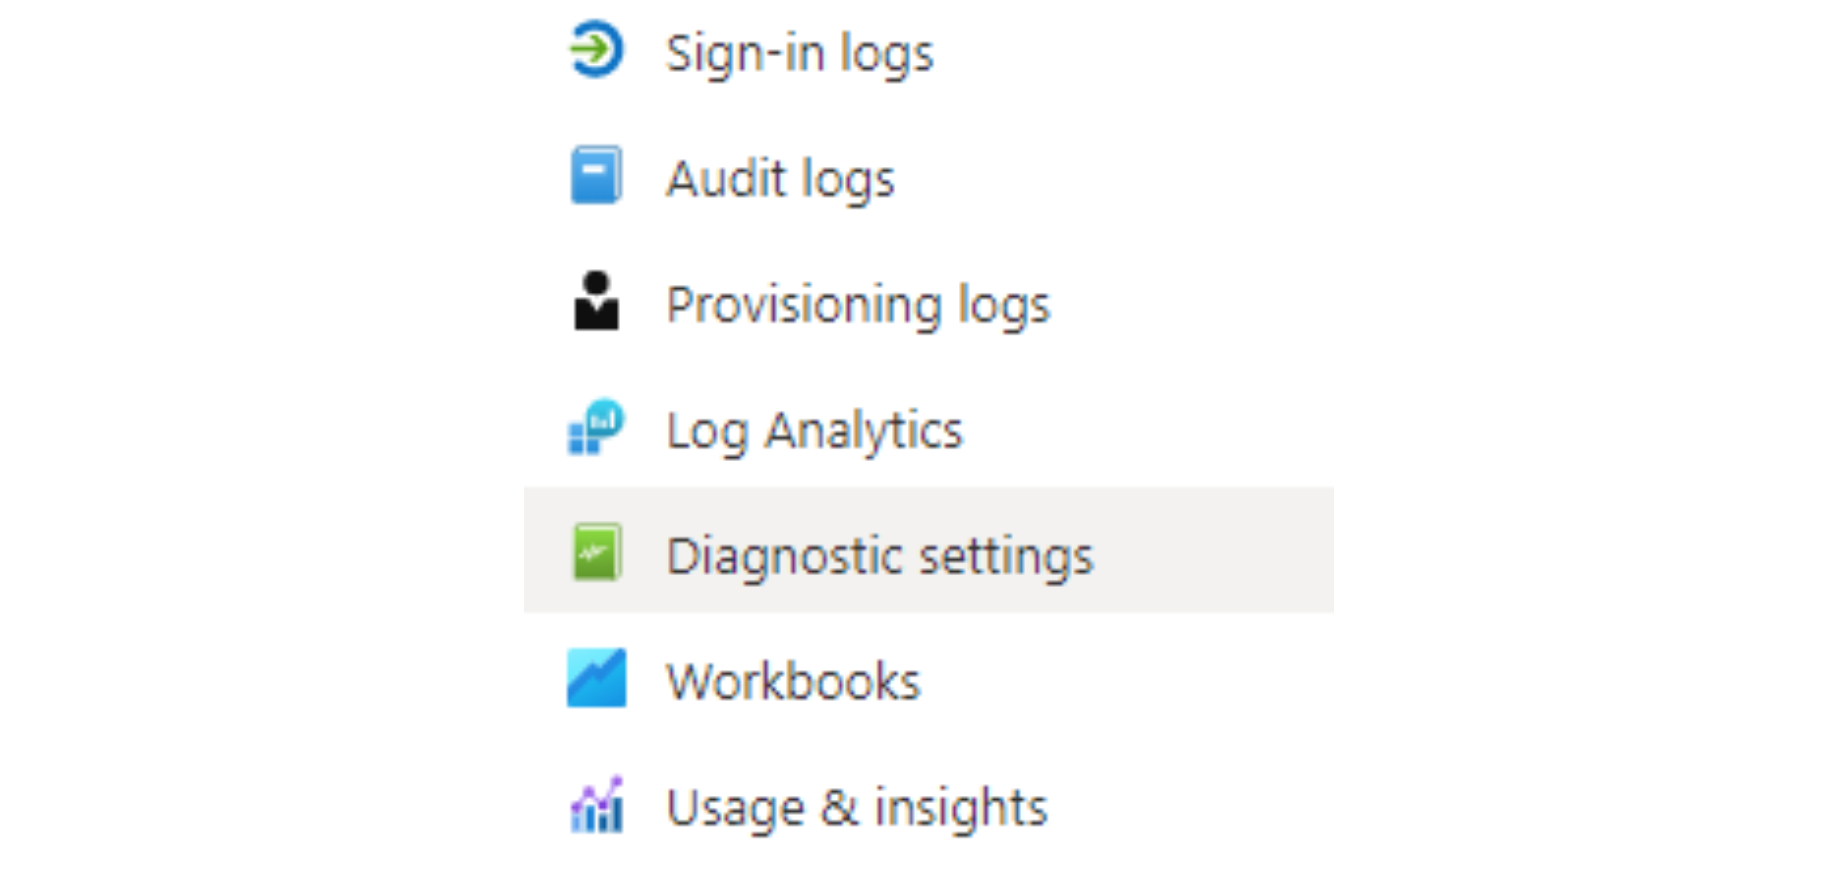
Go to Azure Active Directory, then Monitoring and the Diagnostic settings.
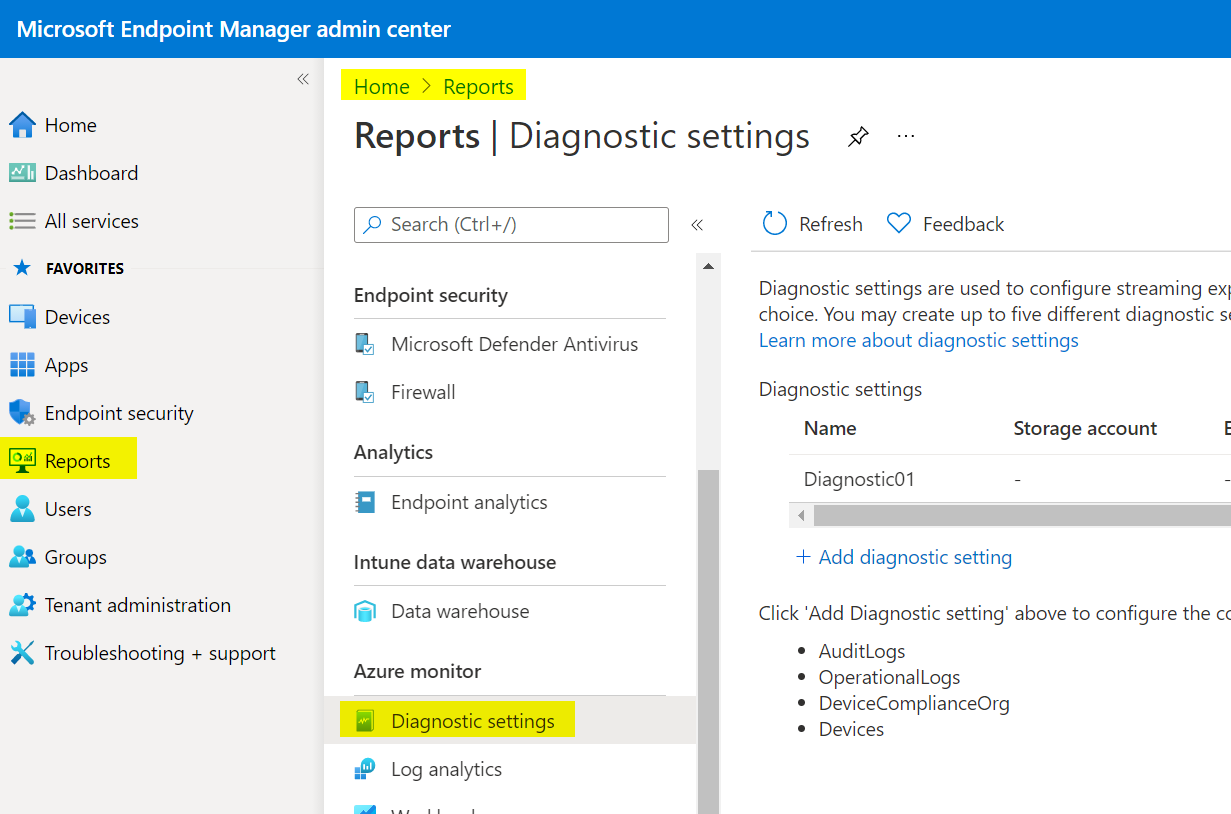
- Intune Endpoint Management
- AuditLogs
- OperationalLogs
- DeviceComplianceOrg
- Devices
This one is in Endpoint Manager admin center, under reports and Azure Monitor.

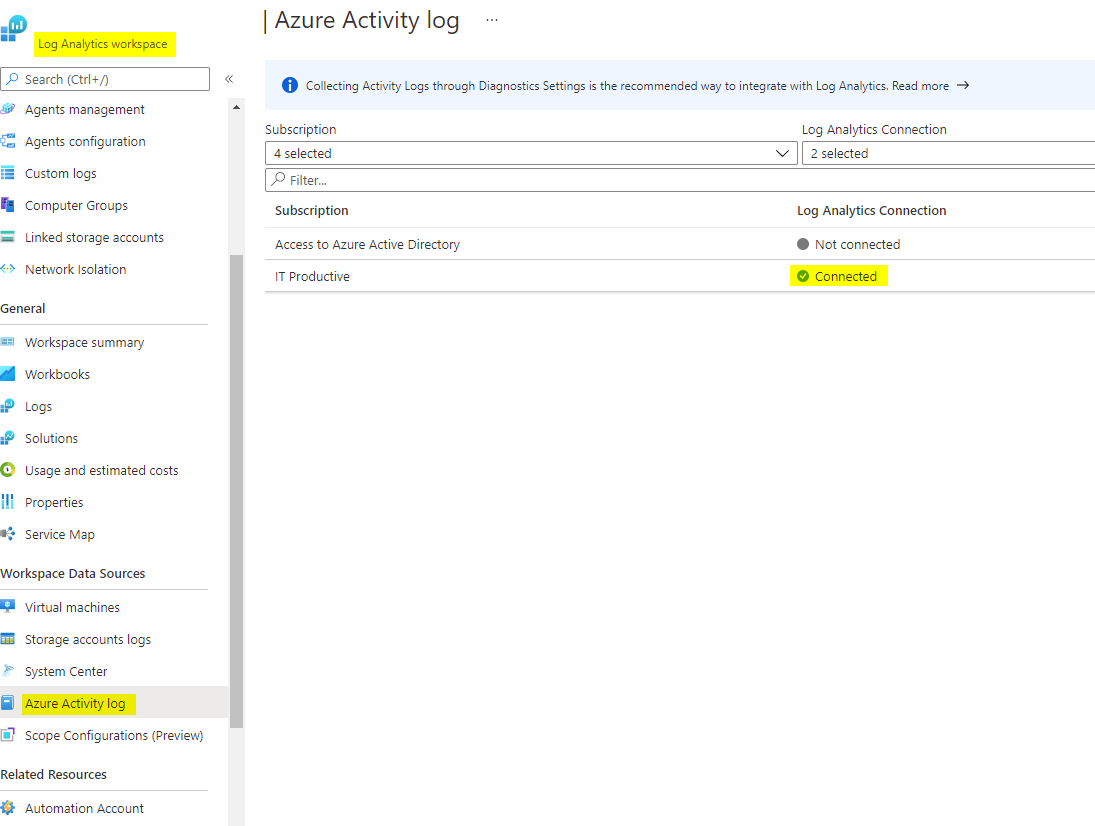
- Azure subscription activity
To log Azure activities on subscription level, go to your Log Analytics workspace, Workspace Data Sources and Azure activity log. You must activate the connection separately for each subscription.
and many many more... but the concept is always the same. You enable diagnostic settings and specify the log category and where it should be stored.
Agents
Log Analytics Workspace can also fetch logs from Windows or Linux systems. The Windows Monitoring Agent can upload: Windows Event logs, Syslog, Performance, IIS logs or custom logs. More information
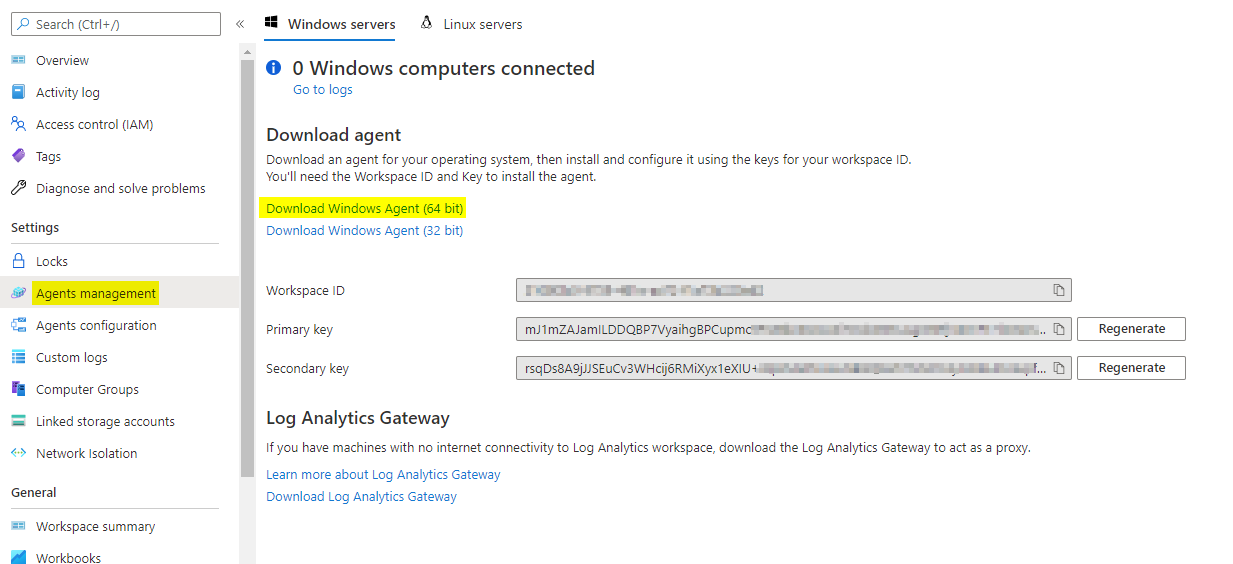
Agents management
When installing the Agent you need to provide a Workspace ID, aswell as a Primary or Secondary key. This will guarantee the right collection site.
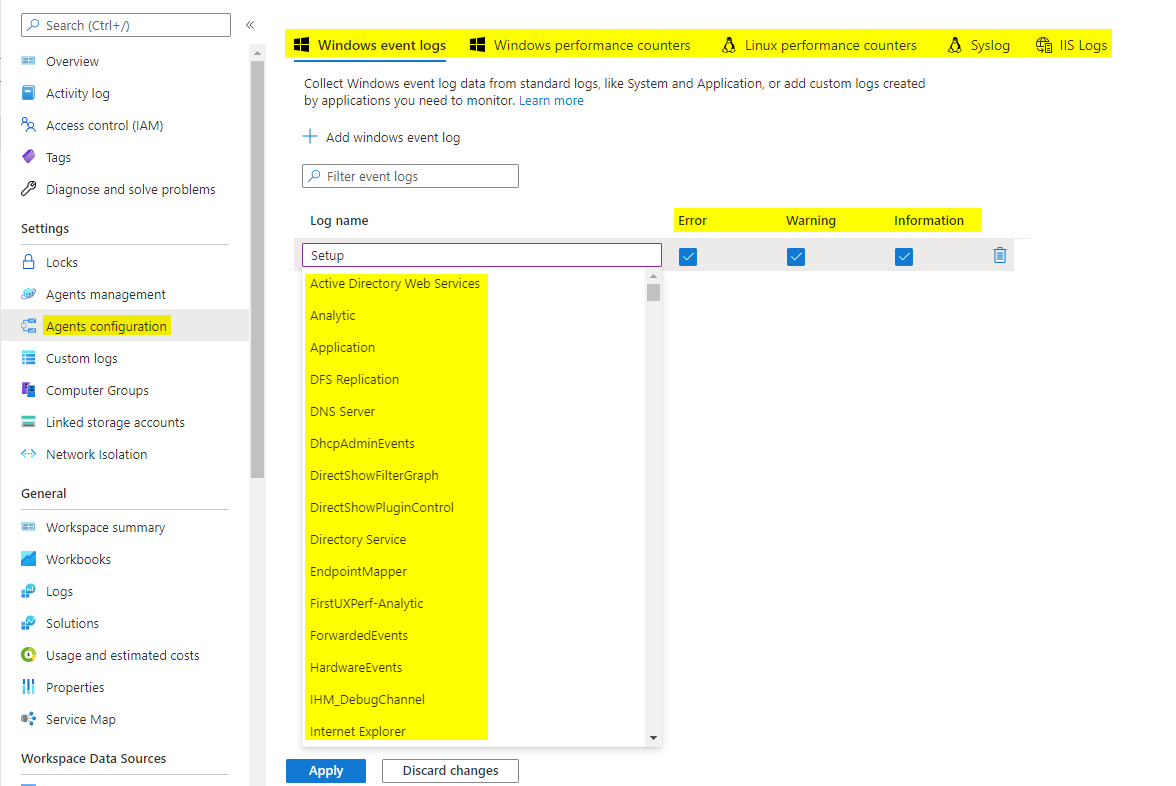
Agents configuration
Here you can specify, which logs are relevant to you. There is a ton of possible ones available. Once you add one, there is the option to choose from Error, Warning or just informational events that occured.
Syntax basics
Let's get into some KQL (Kusto query language) systems to access the collected data and adjust the output.
Construction:
Table - the first line is usually the tablename
| argument 1 - the second line can be an argument
| argument 2 - following lines are used for more arguments
| Command | Effect | Example |
|---|---|---|
| take | outputs you a number of data entries | take 10 |
| project | shows only specific columns | project name, street, city |
| where | filters data on argument | where resource == "Azure" |
| count | counts the output | count |
| summarize count() | summarizes entries and counts equals | summarize count() by country |
| order | orders the output | order by Time |
How to use it
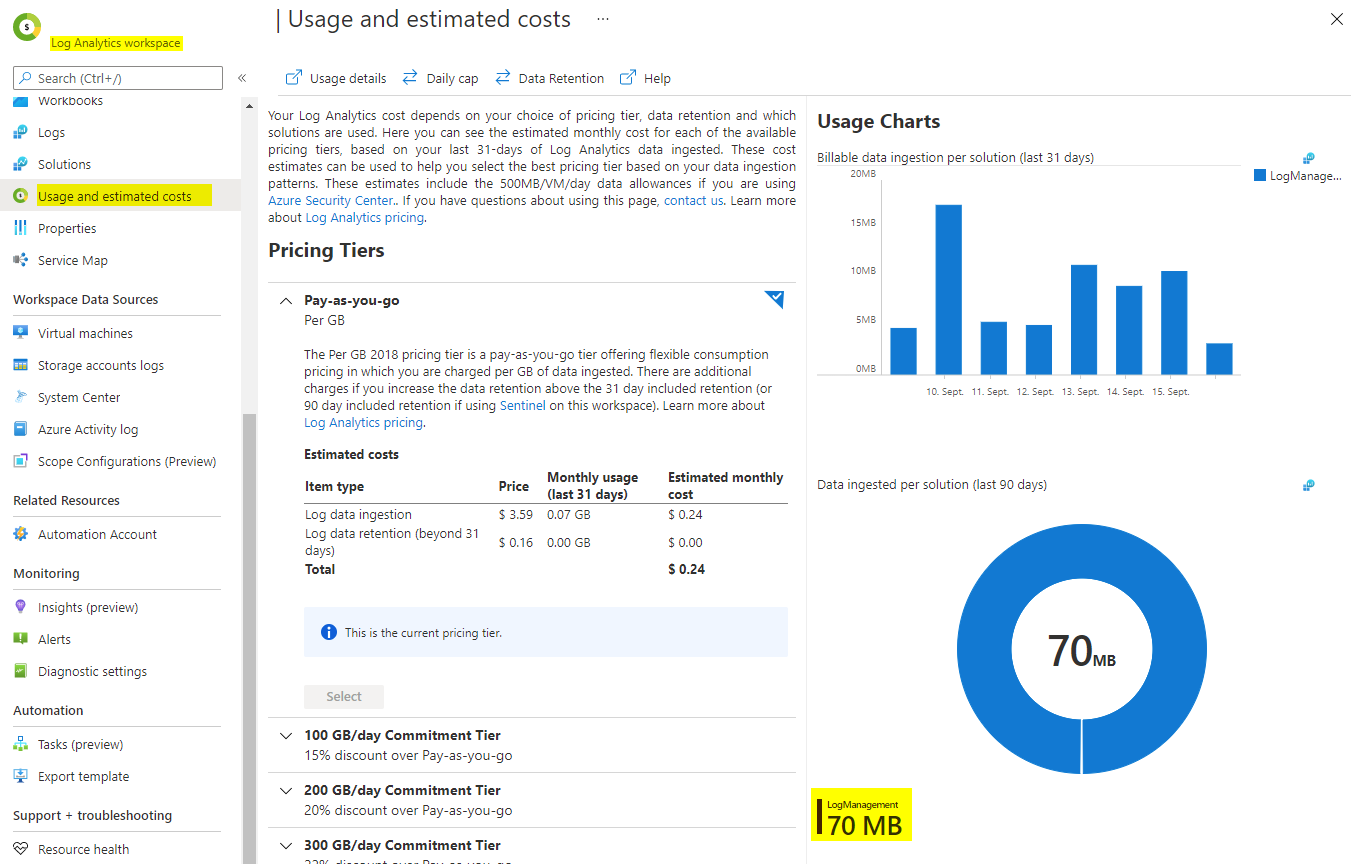
After a few hours, the first data should be visible in your Log Analytics Workspace. You can check this via usage and estimated costs.
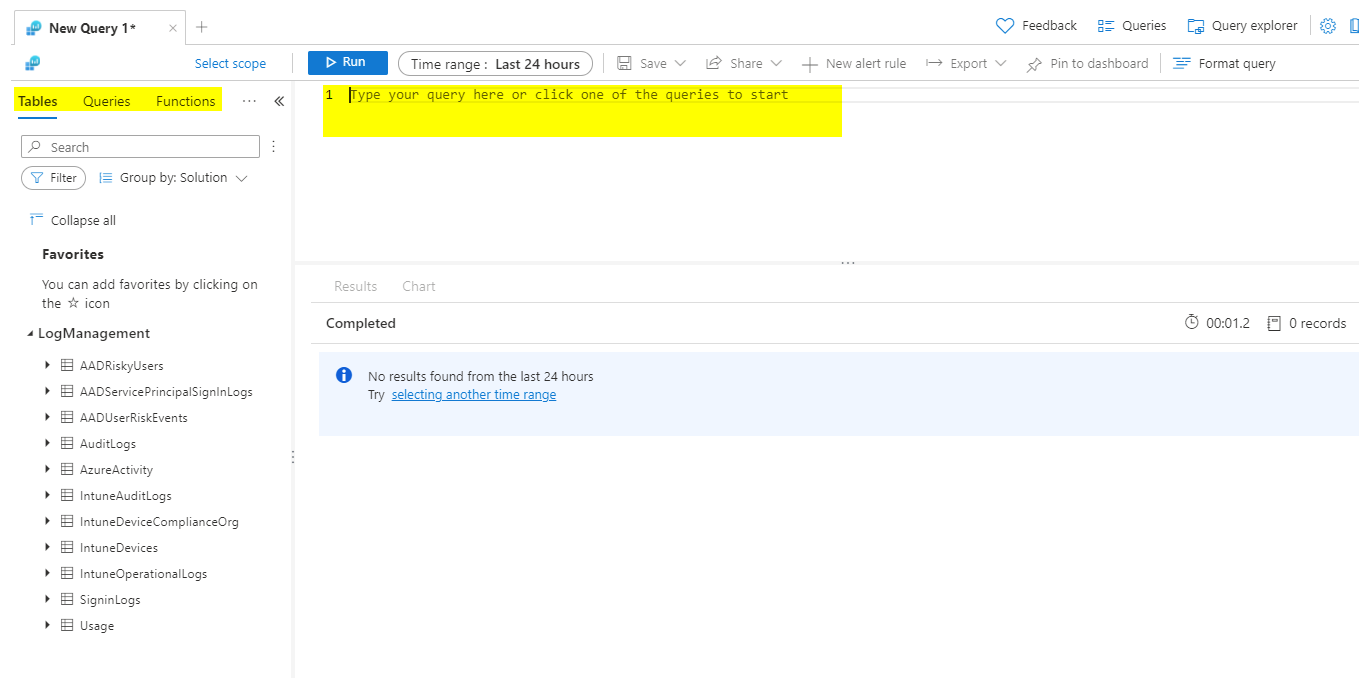
To run queries go to General, then Logs. There will be some recommendations that you can run directly and see results.
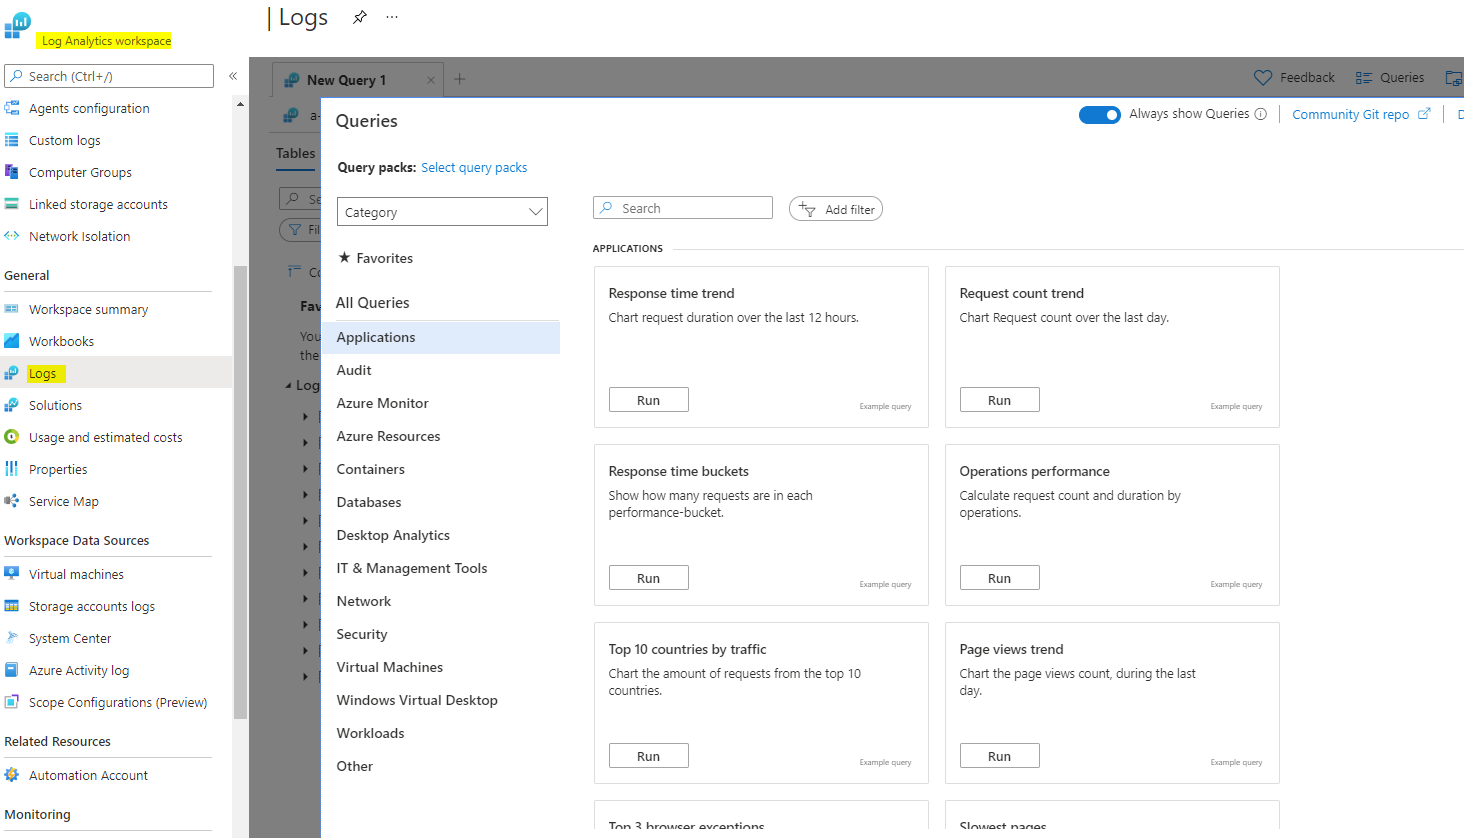
You have 3 main tabs:
- Tables form the structure and hold the data
- Queries show recommened examples and your own queries
- Functions are some type of stored query that can be called
AAD
Here are some examples queries, that also provide a visualization. There is the option to customize the time range from the last 30 mintues up to a custom range of months. If you want, you can also save those queries, share and export or create an alert rule.
Signins form locations, piechart
SigninLogs
| where Location != ''
| summarize count() by Location
| render piechart
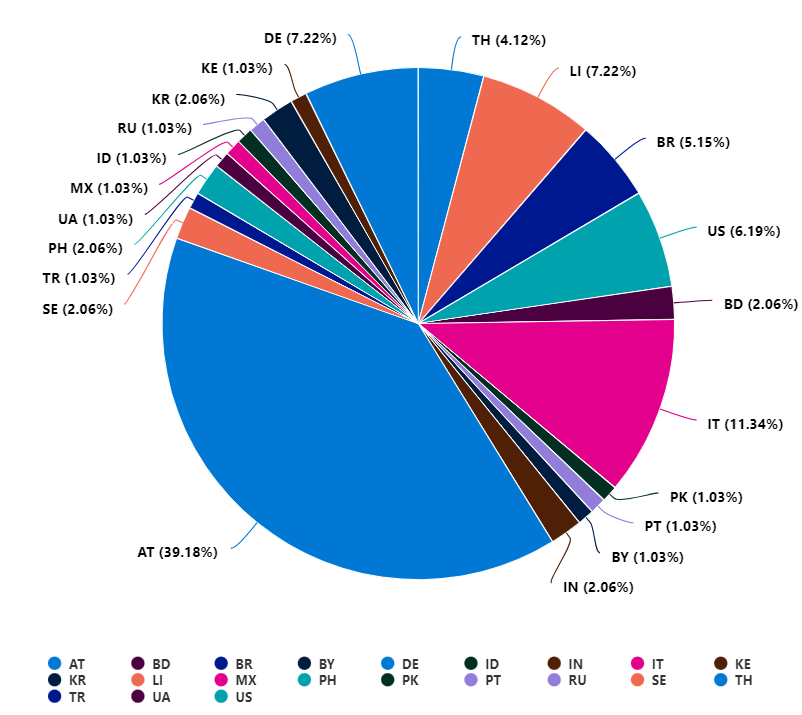
Example output
Intune
Devices OS, columnchart
IntuneDevices
| summarize count() by OS
| render columnchart
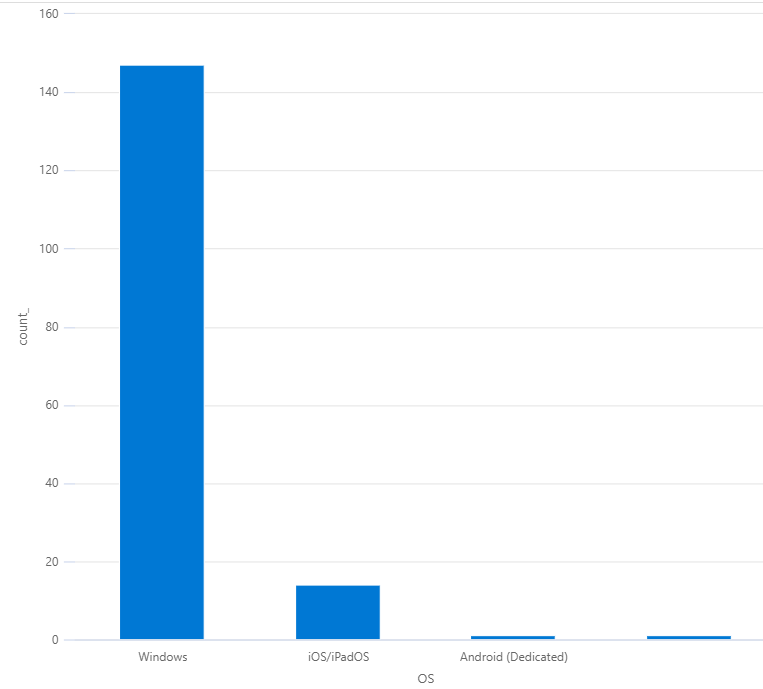
Example output
Devices Windows OS Version, barchart
IntuneDevices
| where OS == "Windows"
| summarize count() by OSVersion
| render barchart
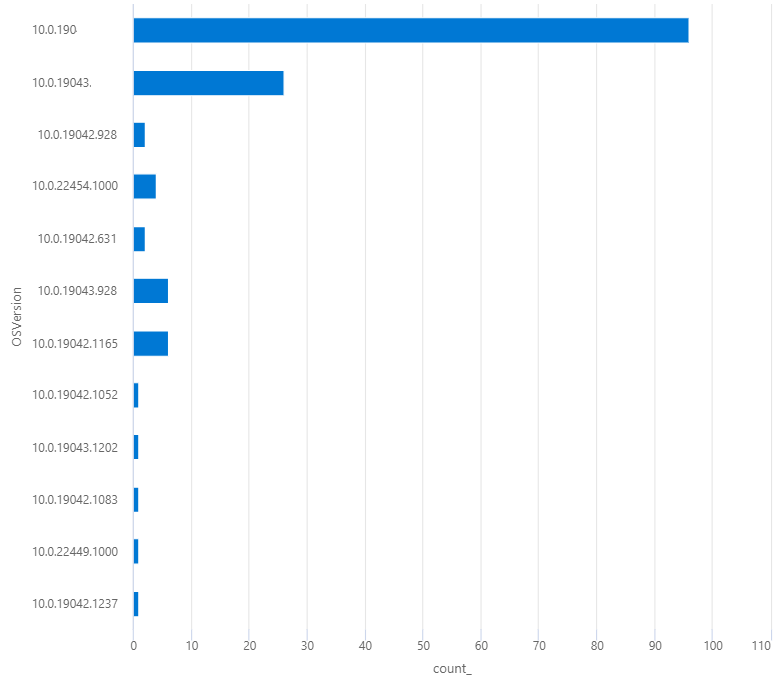
Example output
Log Analytics Workspace
Usage tracking of LAW, timechart
Usage
| project TimeGenerated, DataType, Quantity
| render timechart
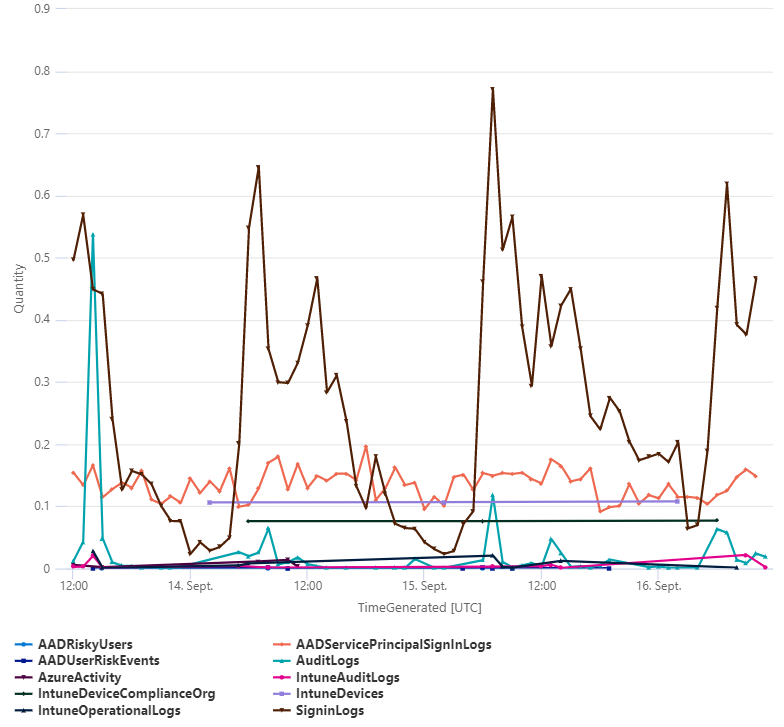
Example output