
Logs & Monitoring in Entra ID
Understanding processes in any type of system or orchestration is central to future adaptation and change. It helps to see if everything works fine or determine interruptions or problems. Also, for investigation purposes, past events are stored and are accessible to understand an event. And visualization is perhaps one of the most important things when it comes to presenting data. This will help you to see how your users interact with Azure AD.
Base monitoring
Azure Active Directory has an integrated monitoring section, that houses:
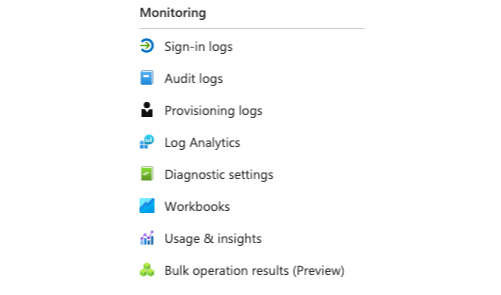
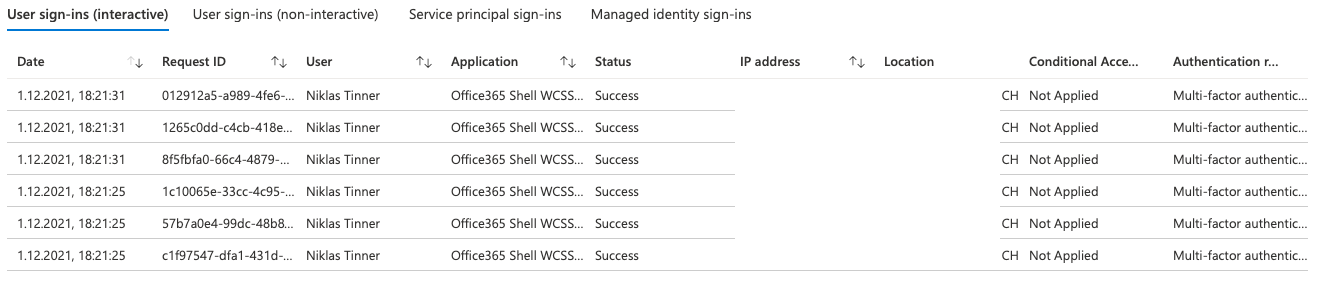
Sign-in logs
Sign-in logs show any authentication against Azure AD with the corresponding information.
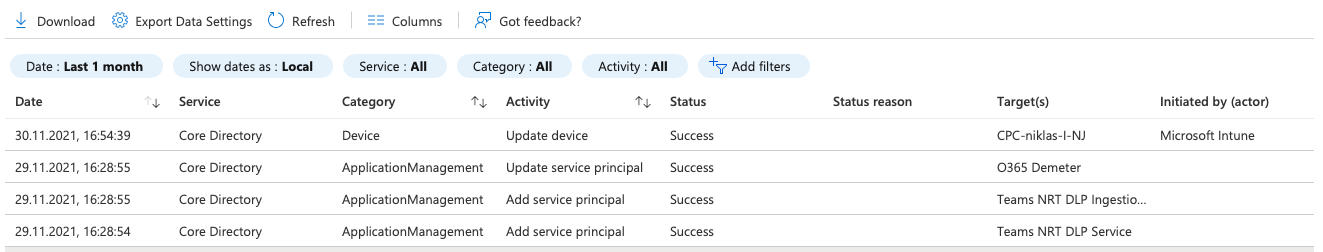
Audit logs
Display events on Azure resources. So it's all about operational logs from your tenant.
Provisioning logs
Provisioning logs are generated from the provisioning service when creating or modifying resources.
Log analytics workspace
If you want more insight with custom queries or store data for a longer period of time, you should consider running a Log analytics workspace. This Azure resource requires extra pricing, not included with Azure AD. If you want to run serious logging in the cloud, there will be no way around this service. Read my full tutorial on Log analytics workspace for more information.
Workbooks
Workbooks cover the visualization aspect of logs in AAD. This option is great to get fast and powerful visualized data sets of logs. There are some example workbooks available:
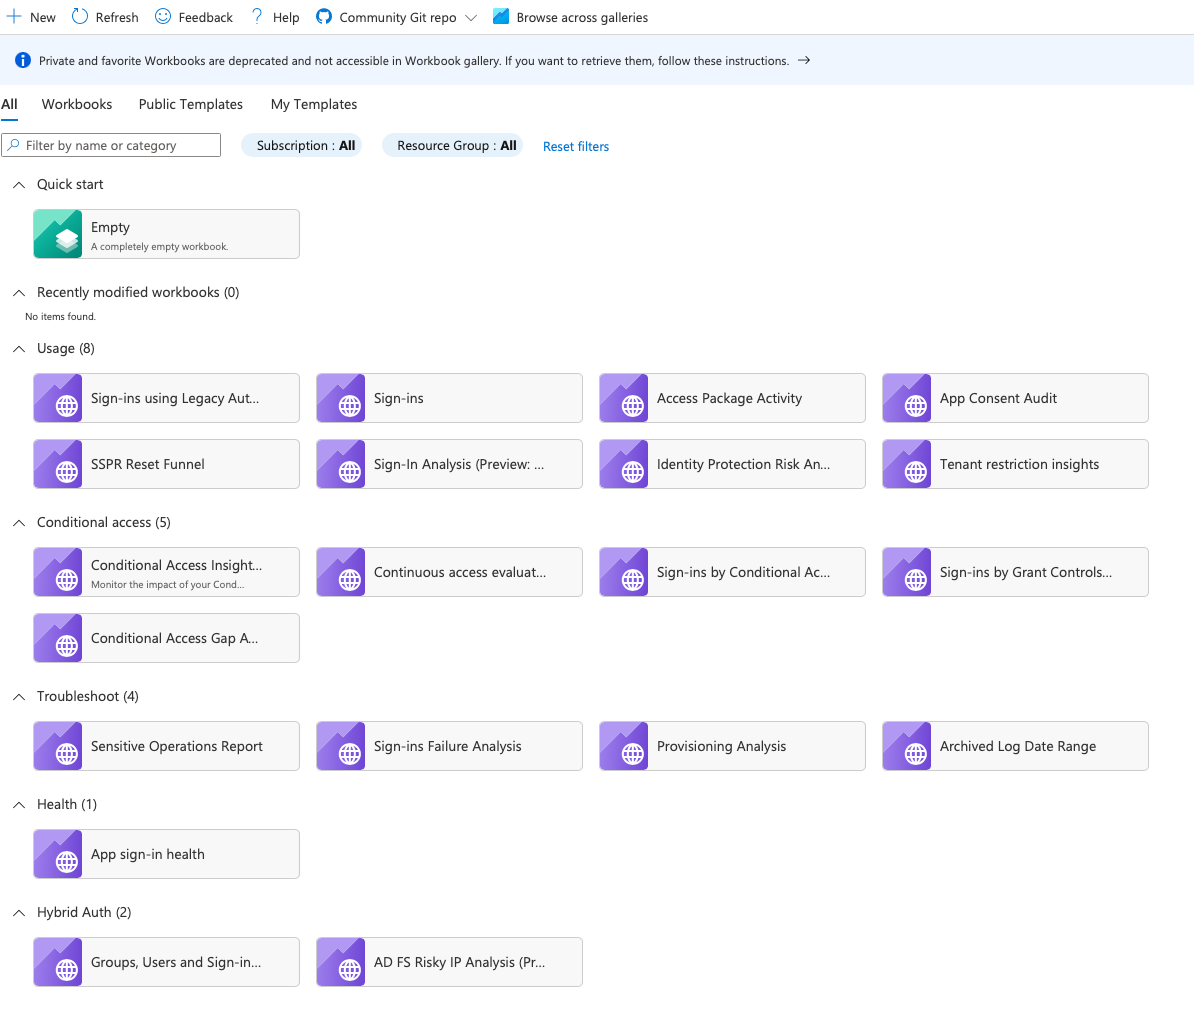
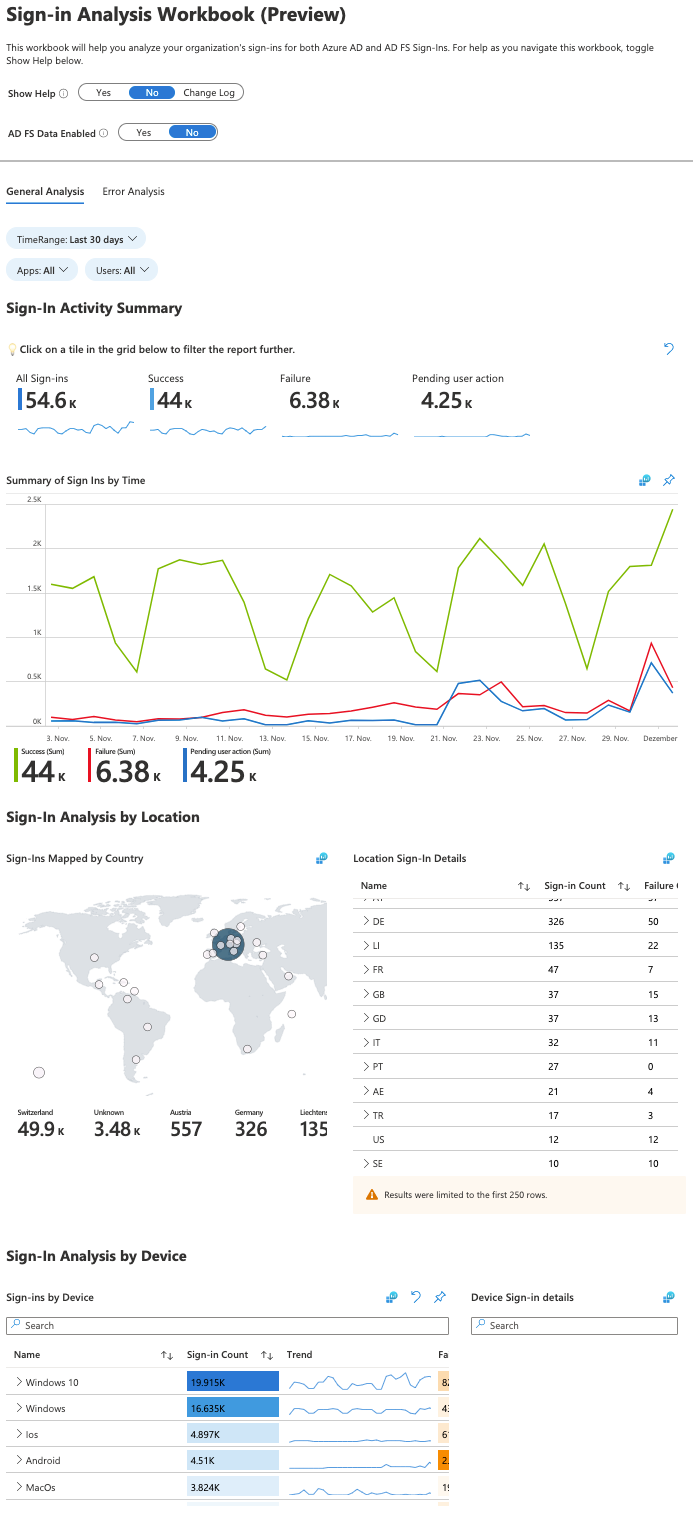
Workbook sample
I selected the workbook "Sign-in Analysis Workbook (Preview)". As you see, it's all well structured, displaying the most important information, graph analytics and grouping in this report.
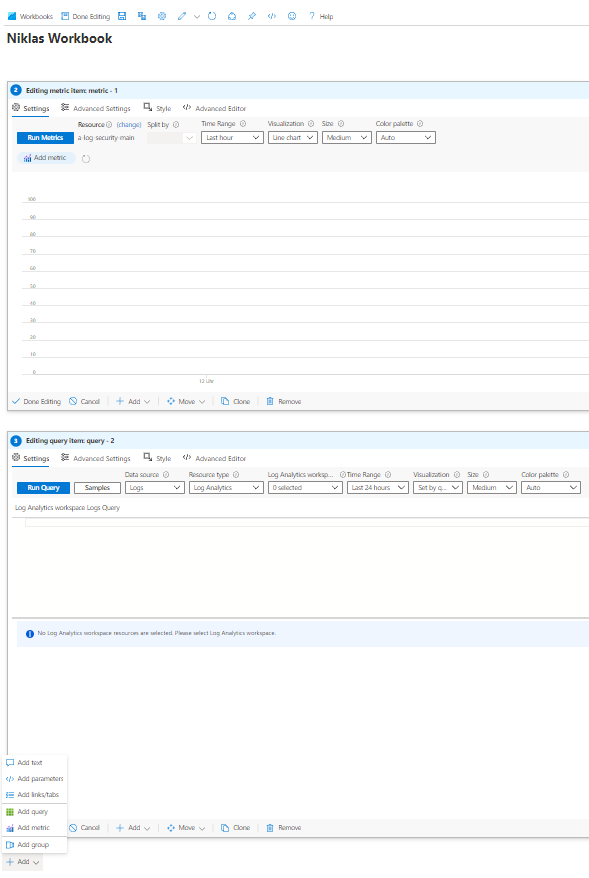
Creating own workbooks
You can create own workbooks by adding text, parameters, links/tabs, queries or metrics to customize your experience.
Multi-Factor Authentication (MFA)
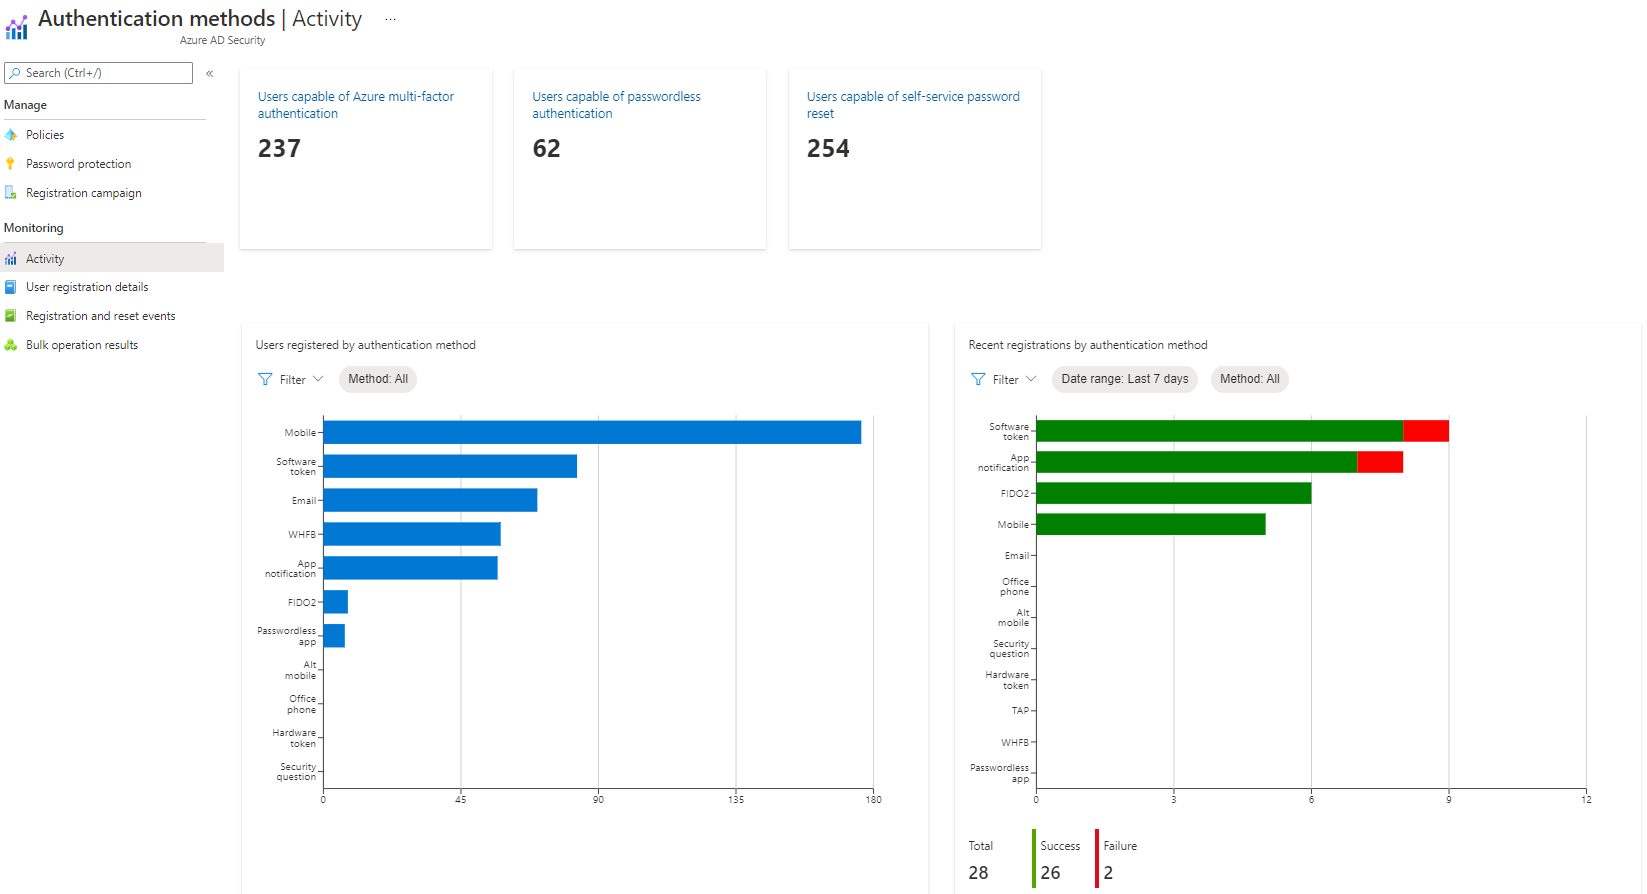
To get an idea of how much and how MFA is used by your users, you can navigate to Azure AD Authentication methods, then Activity.
At the top you can see how much users are capable of MFA authentication, password-less authentication or SSPR. This tab also reveals MFA methods and recent registration events.
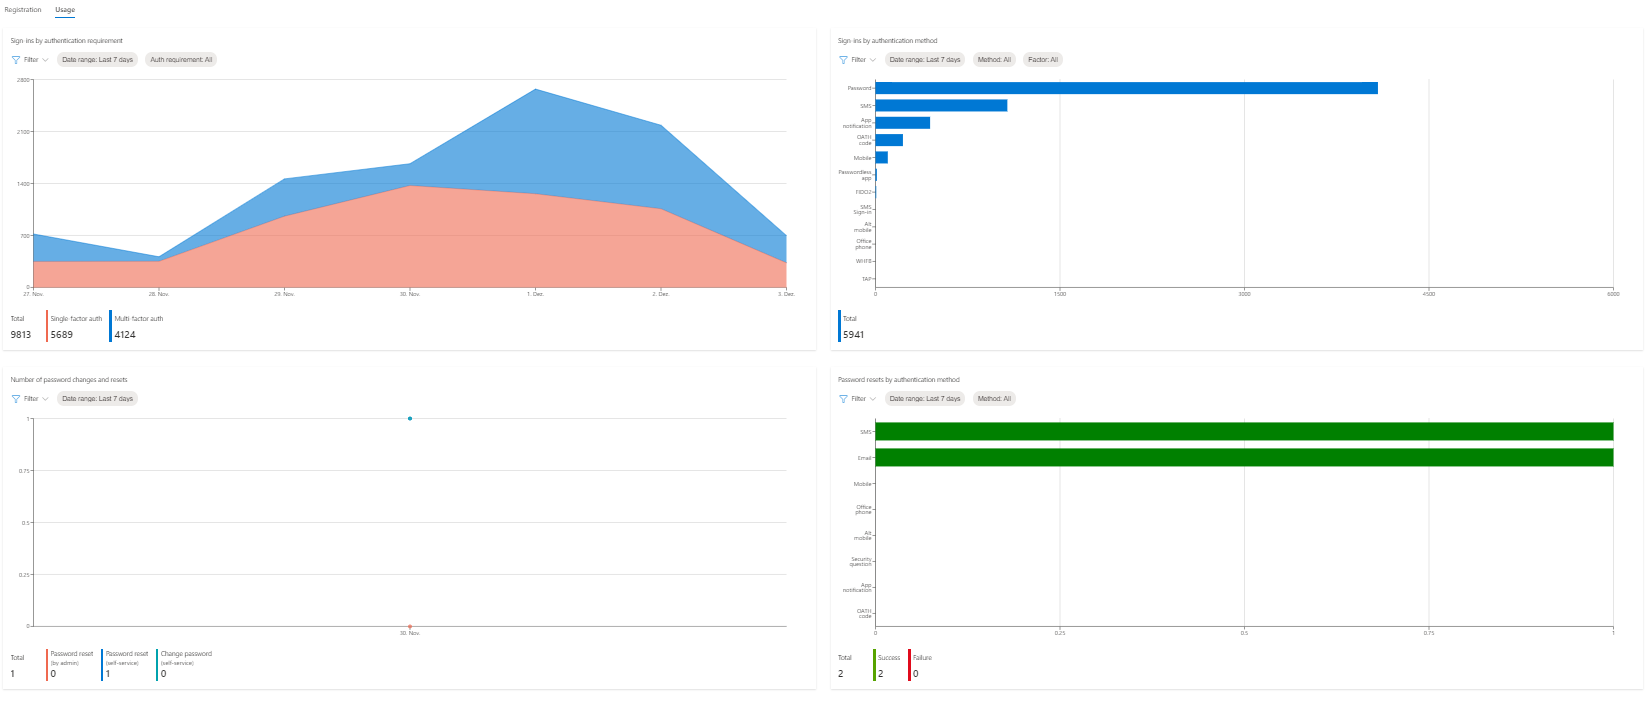
Switch to usage for more metrics on single- and multi-factor authentication sign-ins and the methods, which where used.
Conditional Access
Reports are located in the Azure AD Conditional Access section in Insights and reporting.
I think this is generally a good overview to see where and how CA was triggered, based on the conditions of authentications in your environment.
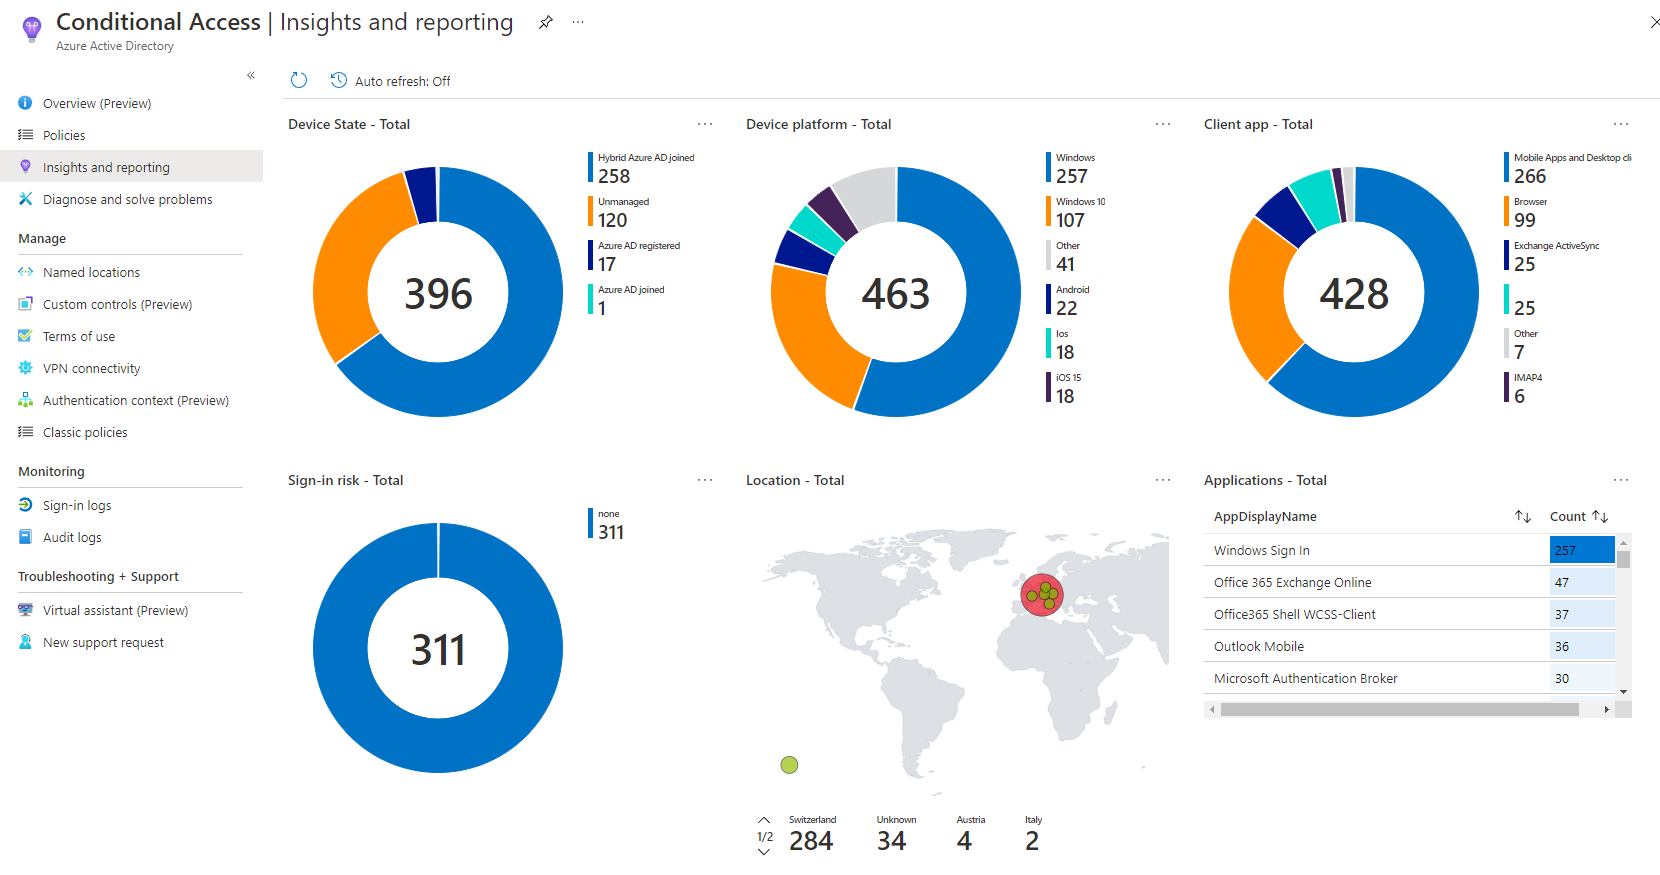
At the side you have more options for more detailed reports on user registration details and events or bulk operation results.
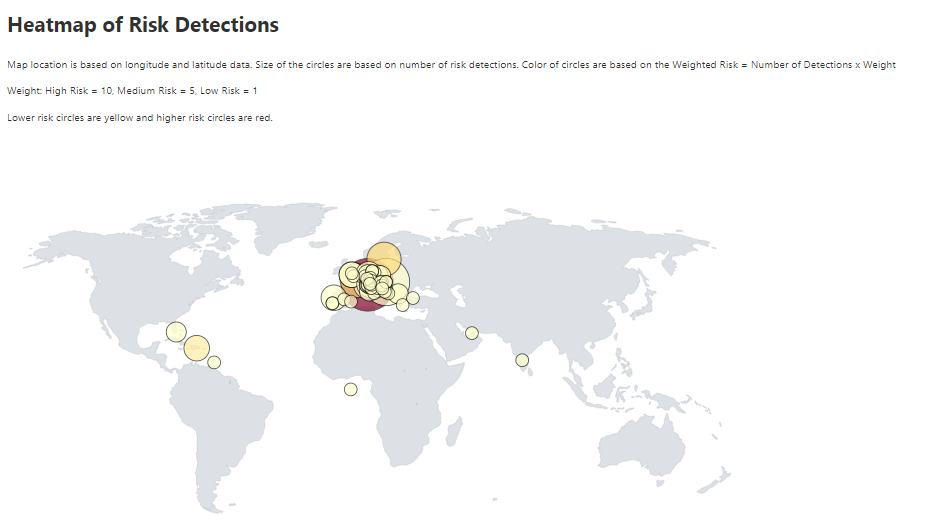
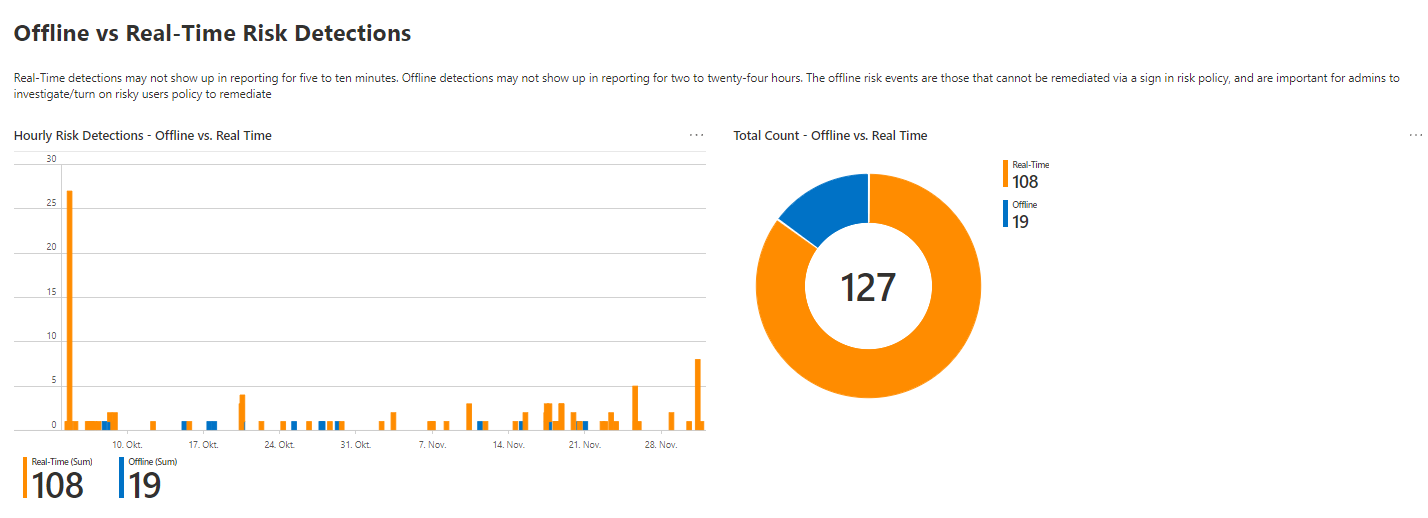
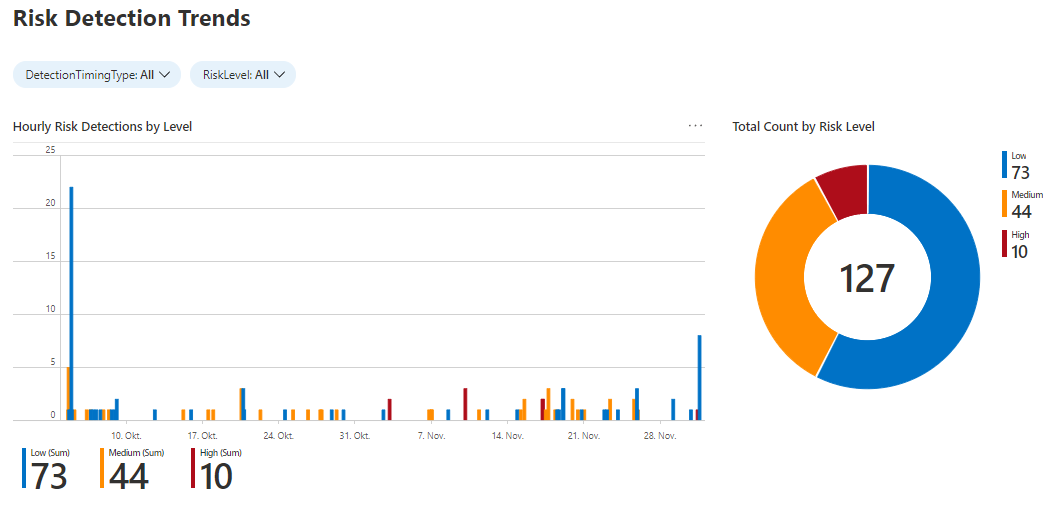
Identity Protection
There is a relatively new workbook on Identity Protection that I love! This includes information about:
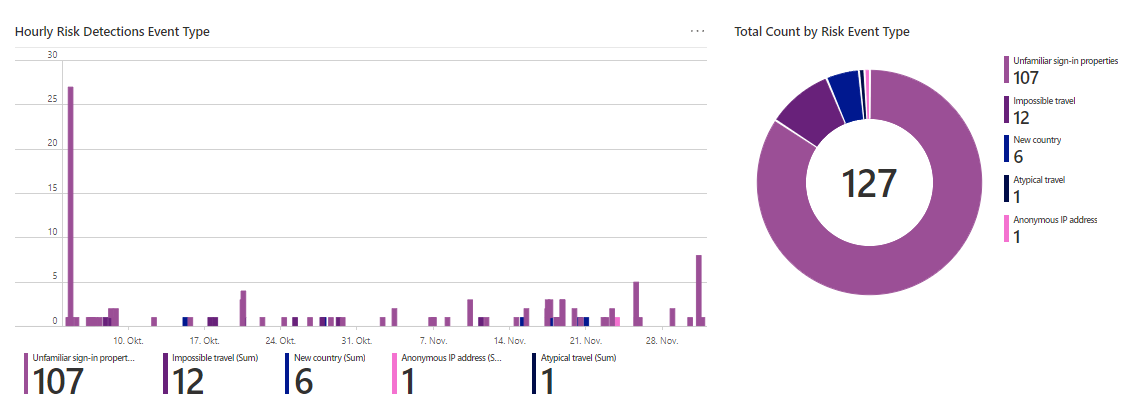
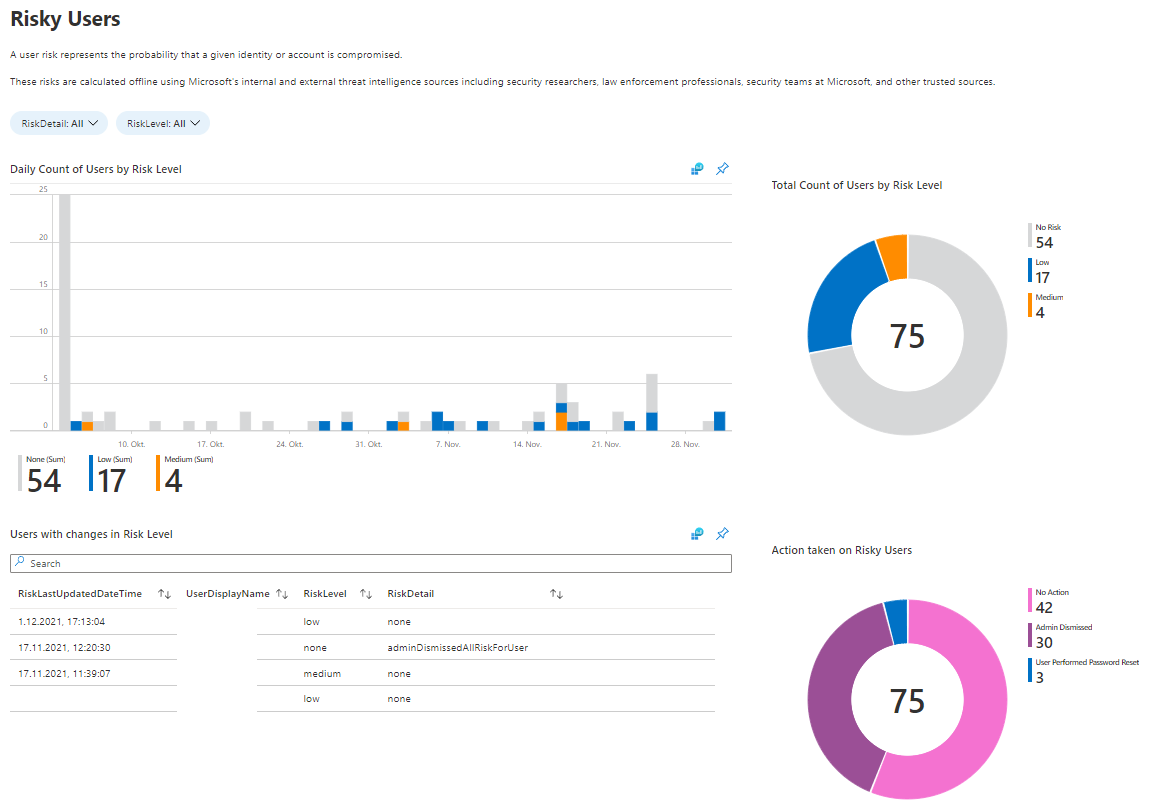
What to do with this data
Well, in the end it's up to you which conclusion this data delivers. Most of the time it's an awareness of the user sided usage of Azure AD. Regarding security, there are lots of sources in this reports. Yet, it's time to take actions.